FIG. 1 — Scanned engineering drawings to an auditable process graph
Deterministic P&ID Extraction
A nine-stage computer-vision and spatial-database pipeline that converts scanned piping & instrumentation diagrams into a queryable process graph: components, pipes, tags, and connectivity. The core extraction path uses no machine learning at all, and that choice drives the whole design.
- Status
- In active development
- Context
- 2026 · Independent work
- Role
- Sole designer & engineer
- Code
- Private — on request
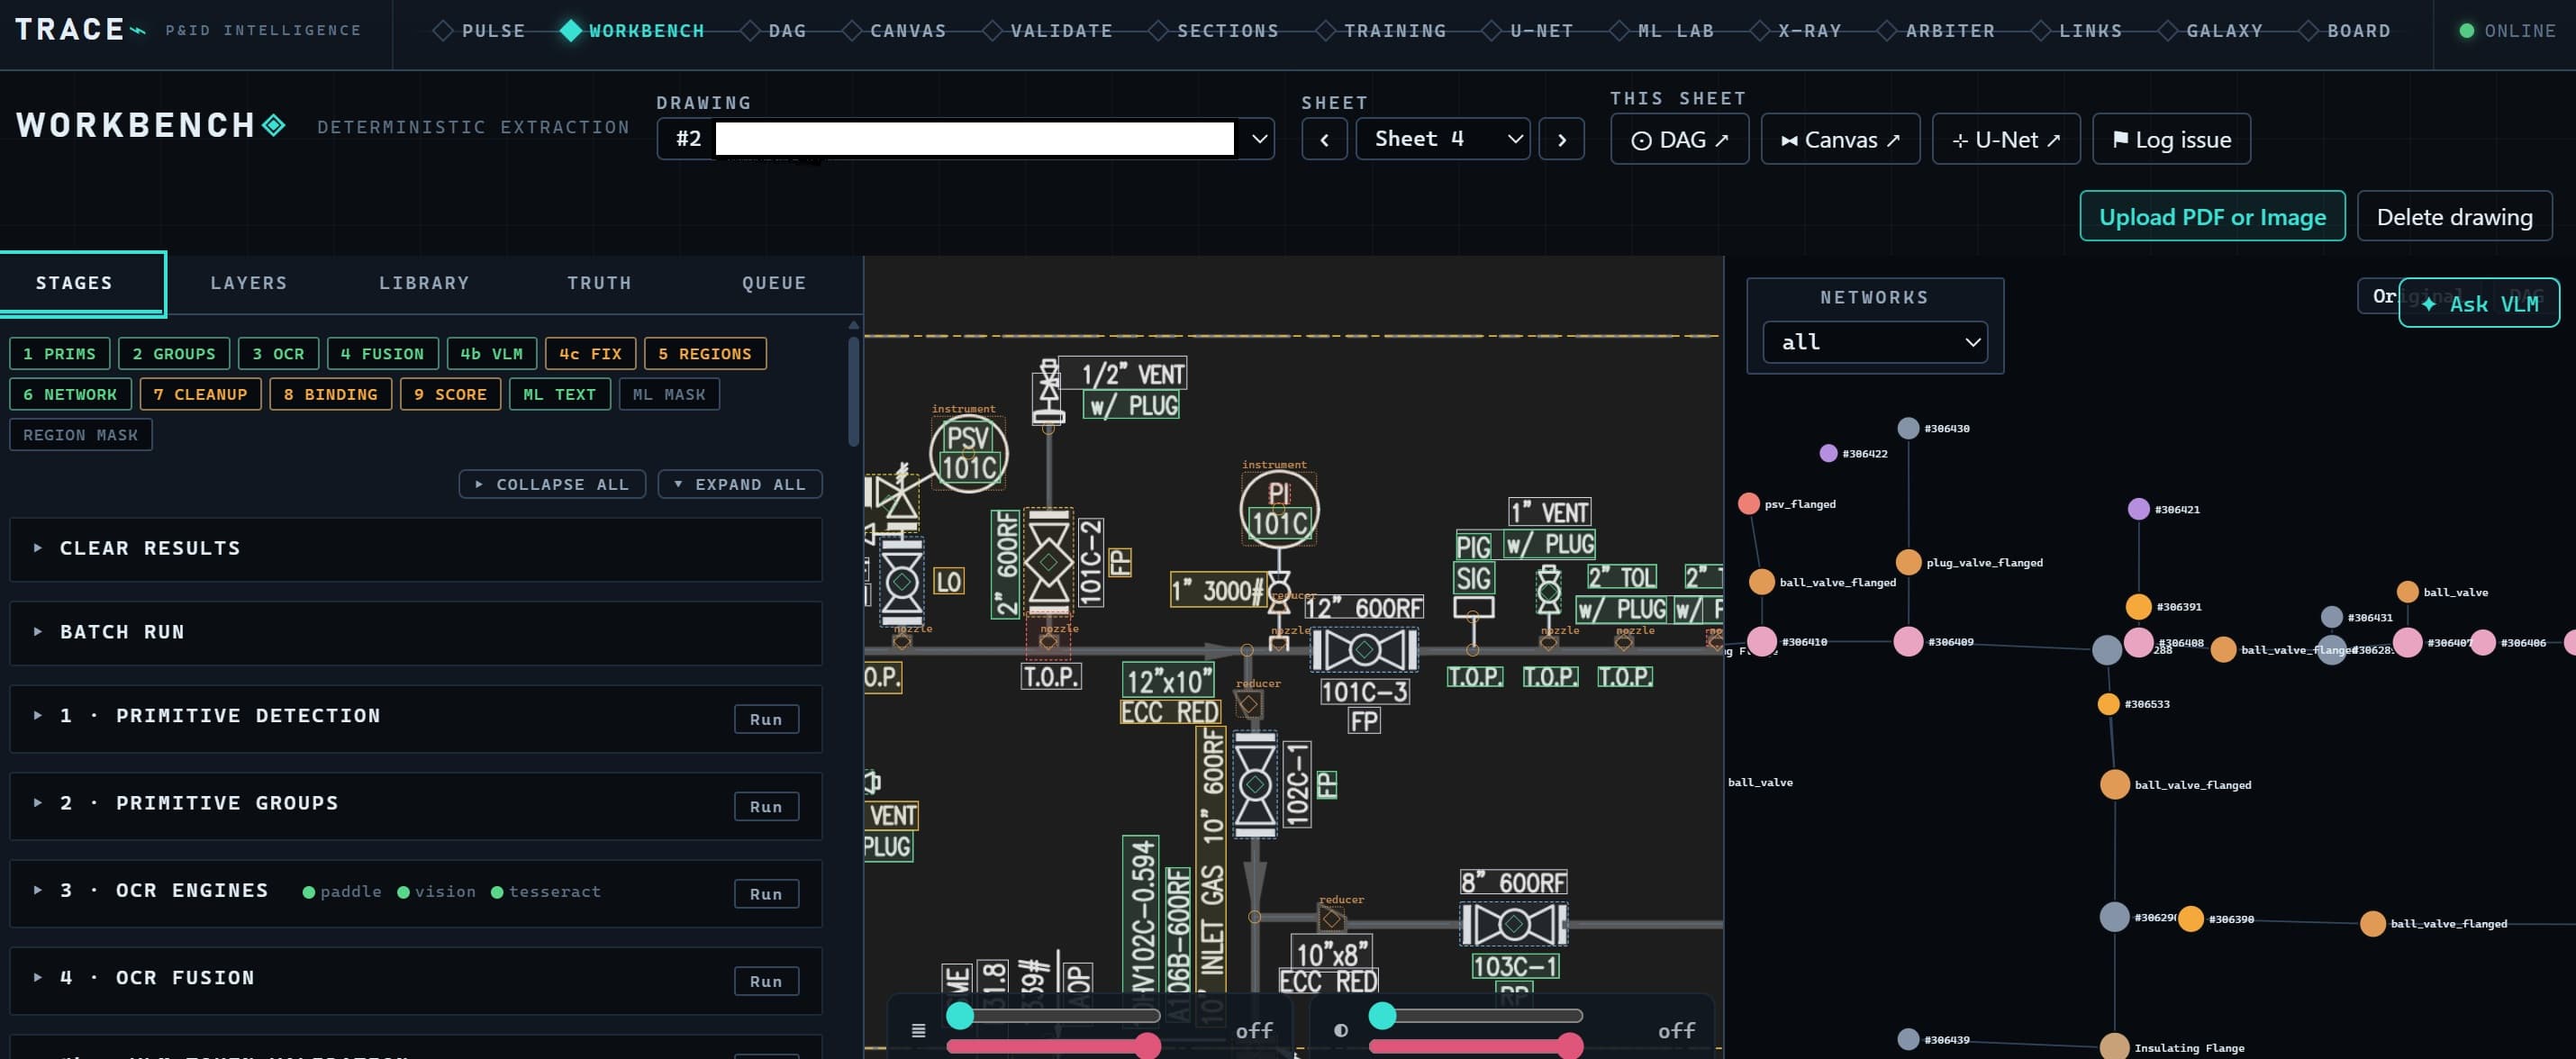
The workbench mid-extraction: the nine-stage pipeline on the left, detected symbols and cross-validated OCR reads overlaid on the drawing, and the assembled network graph taking shape on the right.
The problem
Every valve, instrument, and line in a process plant is documented on a P&ID, and in most operating companies those drawings are scans. The knowledge on them is authoritative and complete, and none of it is available to software.
The obvious approach is to train a symbol classifier. I decided against it: a trained classifier gives you an answer you can't explain, can't reproduce exactly, and can't trace back to the pixels that produced it.
For engineering drawings, that's disqualifying. If a topology is going to inform an isolation decision or a management-of-change review, someone will eventually ask why the system believes a particular valve exists, and “the model said so” isn't an answer that holds up. Auditability matters as much as accuracy here.
How it works
- 01
Nine deterministic stages
The same PDF always produces the same graph. Primitive detection, symbol-group matching, OCR, OCR fusion, page regions, network assembly, cleanup, text binding, confidence scoring — each stage is built on geometry and statistics, and every threshold is documented against measured evidence, never tuned by feel.
- 02
A shape classifier built from contour geometry
I wrote it from scratch on contour and hole-geometry analysis instead of Hough transforms. It identifies valve bodies, tank domes, flanges, and flow arrows straight from raster contours, and unlike a convolutional filter, you can read the logic and argue with it.
- 03
Four OCR engines, cross-validated
pdfplumber, Tesseract, Google Vision, and PaddleOCR each read the drawing. Results are clustered and cross-checked, and confidence comes from how many independent engines agree on a read; no engine's self-reported score is trusted on its own.
- 04
Opposite-evidence cross-suppression
Confirmed text deletes false-positive symbol detections, and confirmed symbol geometry deletes false-positive OCR reads sitting inside it. This is what finally cleaned up the most stubborn ambiguity in the pipeline — a valve bowtie getting read as the letters “PED”. Each evidence type disproves the other, so bad detections die early instead of piling up downstream.
- 05
The graph lives in PostGIS
Pipe and signal lines are traced and snapped into a proper node-and-edge graph with a topological cycle check. A Postgres generated column computes confidence and routes each result to auto-accept, human review, or reject. Data access is raw parameterized SQL with no ORM, so every query that produced a result can be read and re-run.
- 06
Raw evidence is immutable; human corrections win
Raw OCR tokens and primitive detections persist unchanged forever. A fused layer merges automated results, VLM arbitration, and human-verified corrections in explicit priority order — human above VLM above automated — so nothing downstream can silently overwrite a correction someone entered by hand.
- 07
Where the models fit
Two narrow, fenced roles. A tool-calling agent exposes exactly four functions — graph query, revision diff, SVG overlay, document export — and only ever queries the finished graph; it never sees pixels. An optional vision-language oracle arbitrates the lowest-confidence OCR disagreements behind a sha256-keyed replay cache, so paid calls never repeat, and every verdict it renders gets exported as a labeled training sample. A small weak-supervised U-Net trains on a remote GPU box over MCP as an auxiliary signal for the deterministic pipeline.
Plates
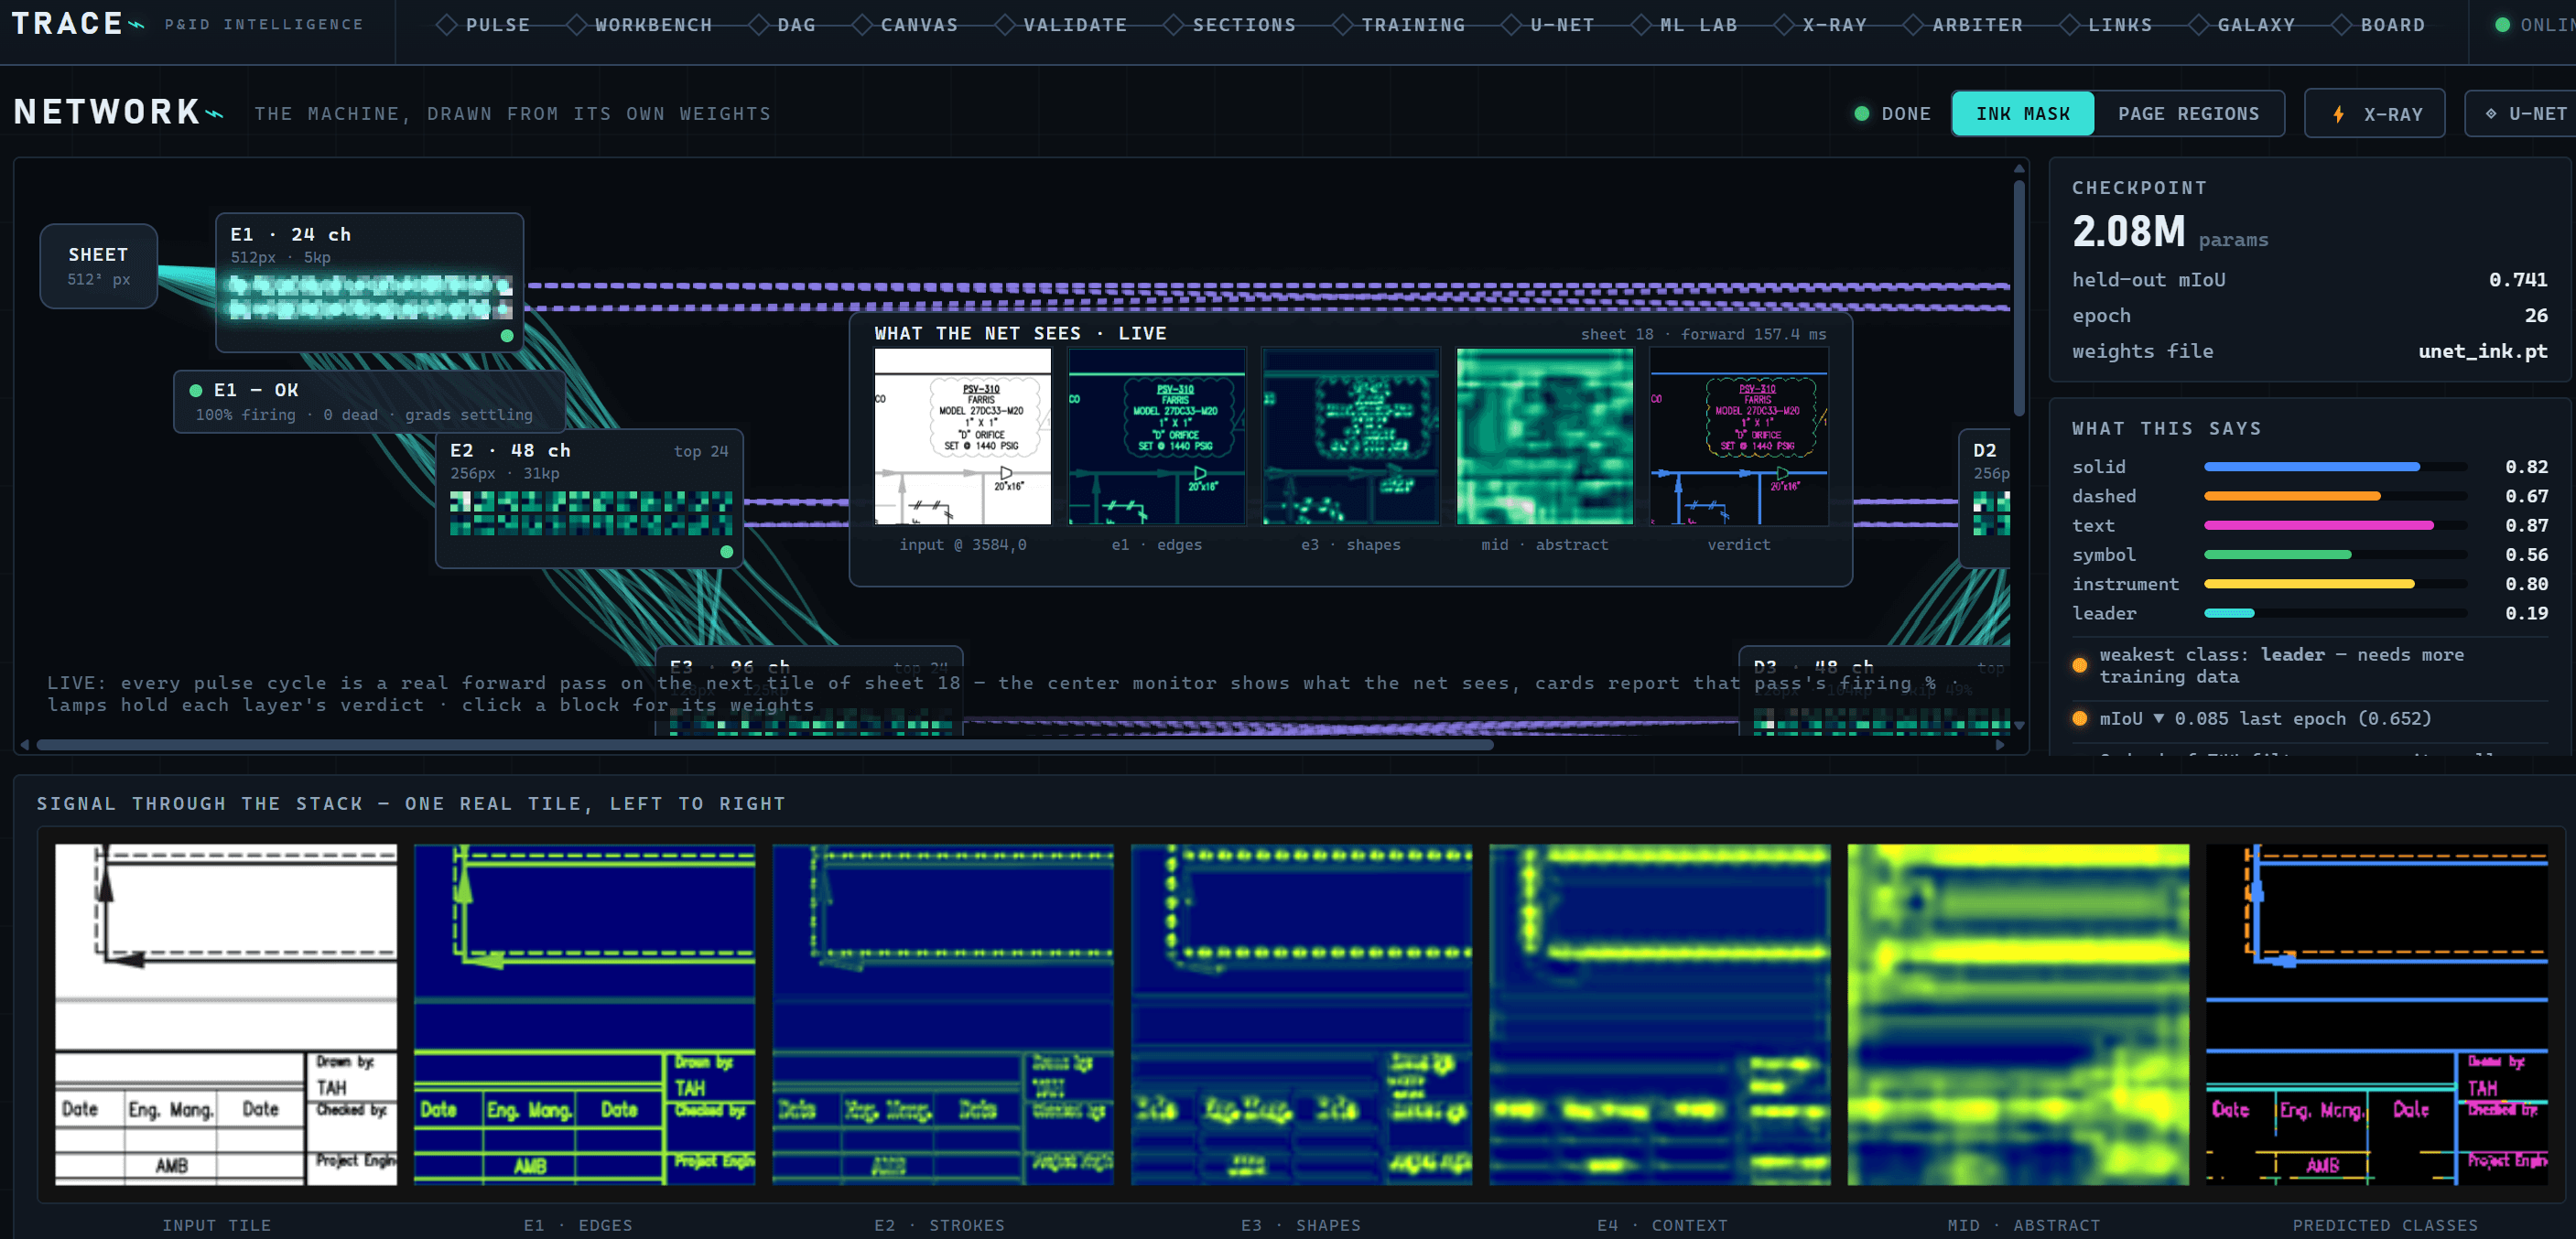
The auxiliary U-Net, drawn from its own weights: every pulse is a real forward pass on a drawing tile, with per-layer activations, per-class scores, and the weakest class called out for more training data.
General note
The same drawing always produces the same graph, and every element of that graph traces back to the pixels that produced it. Everything else in the design follows from those two requirements.
Why it matters
Engineering organizations can only adopt tools they can audit. This one was built around that constraint from the start.
Every output is re-derivable from stored raw evidence. Three months later you can still answer why the system believed a valve was there.
The language models are fenced in: the agent only queries the finished graph, and the VLM only sees the handful of reads where independent OCR engines already disagree.
The output is what downstream industrial work needs: isolation and consequence analysis, alarm rationalization, MOC review, and structural ground truth for any model reasoning about the facility.
Stack
- Core
- Python 3.11FastAPIOpenCVShapelypypdfium2
- Spatial data
- PostgreSQLPostGISpgRoutingpgvectorpsycopg3
- OCR
- pdfplumberTesseractGoogle VisionPaddleOCR
- Models
- Local VLM (LM Studio)Azure OpenAIMCP tool interfaceU-Net (2.1M)
- Orchestration
- Docker ComposeIn-process DAG engine
Want the architecture in more depth, or a walk through the code? I'm glad to go there.
Get in touch